

R 编程语言中的内置函数是指已存在或预定义在 R 框架中的函数。内置函数使用户或程序员能够轻松、简单地使用 R 语言进行编程。R 语言为用户提供了一套丰富的预定义函数,以提高计算效率并缩短编程时间。
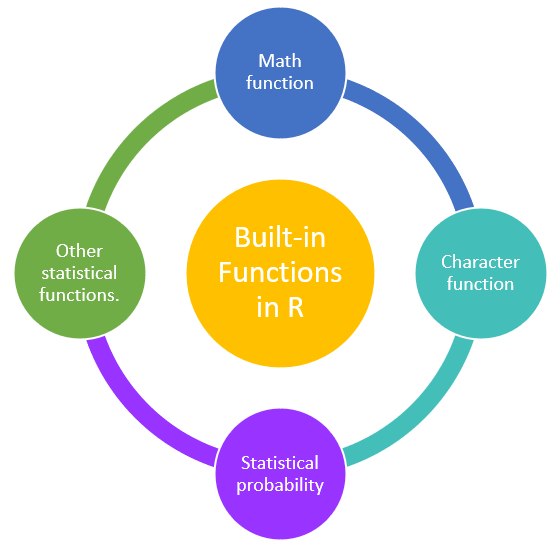
在 R 编程语言中,内置函数进一步分为以下几类:
让我们开始探索 R 编程语言中的一些数学内置函数。
数学函数是指通过一些内置函数进行的数学或数值计算。特定函数的指令集已在 R 程序中预定义,用户只需调用该函数即可完成执行任务。
下表重点介绍了 R 中一些数值或数学内置函数。
| 序号 | 内置函数 | 描述 | 示例 |
|---|---|---|---|
| 1 | abs(x) | 返回输入 x 的绝对值 |
x<- -2 print(abs(x)) 输出 [1] 2 |
| 2 | sqrt(x) | 返回输入 x 的平方根 |
x<- 2 print(sqrt(x)) 输出 [1] 1.414214 |
| 3 | ceiling(x) | 返回大于或等于 x 的最小整数。 |
x<- 2.8 print(ceiling(x)) 输出 [1] 3 |
| 4 | floor(x) | 返回小于或等于 x 的最大整数。 |
x<- 2.8 print(floor(x)) 输出 [1] 2 |
| 5 | trunc(x) | 返回输入 x 的截断值。 |
x<- c(2.2,6.56,10.11) print(trunc(x)) 输出 [1] 2 6 10 |
| 6 | round(x, digits=n) | 返回输入 x 的四舍五入值。 |
x=2.456 print(round(x,digits=2)) x=2.4568 print(round(x,digits=3)) 输出 [1] 2.46 [1] 2.457 |
| 7 | cos(x), sin(x), tan(x) | 返回输入 x 的 cos(x), sin(x), tan(x) 值 |
x<- 2 print(cos(x)) print(sin(x)) print(tan(x)) 输出 [1] -0.4161468 [1] 0.9092974 [1] -2.18504 |
| 8 | log(x) | 返回输入 x 的自然对数 |
x<- 2 print(log(x)) 输出 [1] 0.6931472 |
| 9 | log10(x) | 返回输入 x 的常用对数 |
x<- 2 print(log10(x)) 输出 [1] 0.30103 |
| 10 | exp(x) | 返回指数 |
x<- 2 print(exp(x)) 输出 [1] 7.389056 |
R 编程语言提供了一些内置字符串或字符函数,如下表所示。
| 序号 | 内置函数 | 描述 | 示例 |
|---|---|---|---|
| 1 | tolower(x) | 用于将字符串转换为小写。 | string<- "Learn eTutorials" print(tolower(string)) Output [1] "learn etutorials" |
| 2 | toupper(x) | 用于将字符串转换为大写。 |
string<- "Learn eTutorials" print(toupper(string)) Output [1] "LEARN ETUTORIALS" |
| 3 | strsplit(x, split)) | 在 split 点分割字符向量 x 的元素。 | string<- "Learn eTutorials" print(strsplit(string, "")) Output [[1]] [1] "L" "e" "a" "r" "n" " " "e" "T" "u" "t" "o" "r" "i" "a" "l" "s" |
| 4 | paste(..., sep="") | 使用sep字符串分隔后连接字符串。 | paste("Str1",1:3,sep="") [1] "Str11" "Str12" "Str13" paste("a",1:3,sep="M") [1] "aM1" "aM2" "aM3" paste("Today is", date()) [1] "Today is Sun Feb 27 06:26:31 2022" |
| 5 | sub(pattern,replacement, x,ignore.case=FALSE,fixed=FALSE) | 在x中查找pattern并替换为replacement文本。如果 fixed=FALSE,则pattern是正则表达式。 如果 fixed = T,则pattern是文本字符串。 |
string<- "You are learning GOlang in Learn eTutorials" sub("GOlang","R",string) Output [1] "You are learning R in Learn eTutorials" |
| 6 | grep(pattern, x , ignore.case=FALSE, fixed=FALSE) | 在 x 中搜索 pattern。 | string <- c('R','GO','GOlang') pattern<- '^GO' print(grep(pattern, string)) Output [1] 2 3 |
| 7 | substr(x, start=n1,stop=n2) | 用于提取字符向量中的子字符串。 | string<- "Learn eTutorials" substr(string, 1, 5) substr(string, 4, 10) Output [1] "Learn" [1] "rn eTut" a <- "123456789" substr(a, 5, 3) output [1] "" |
R 编程语言提供了一些统计内置函数来处理概率分布。一些常用的分布函数是 rnorm、dnorm、qnorm、pnorm。这些函数用于分析概率分布。
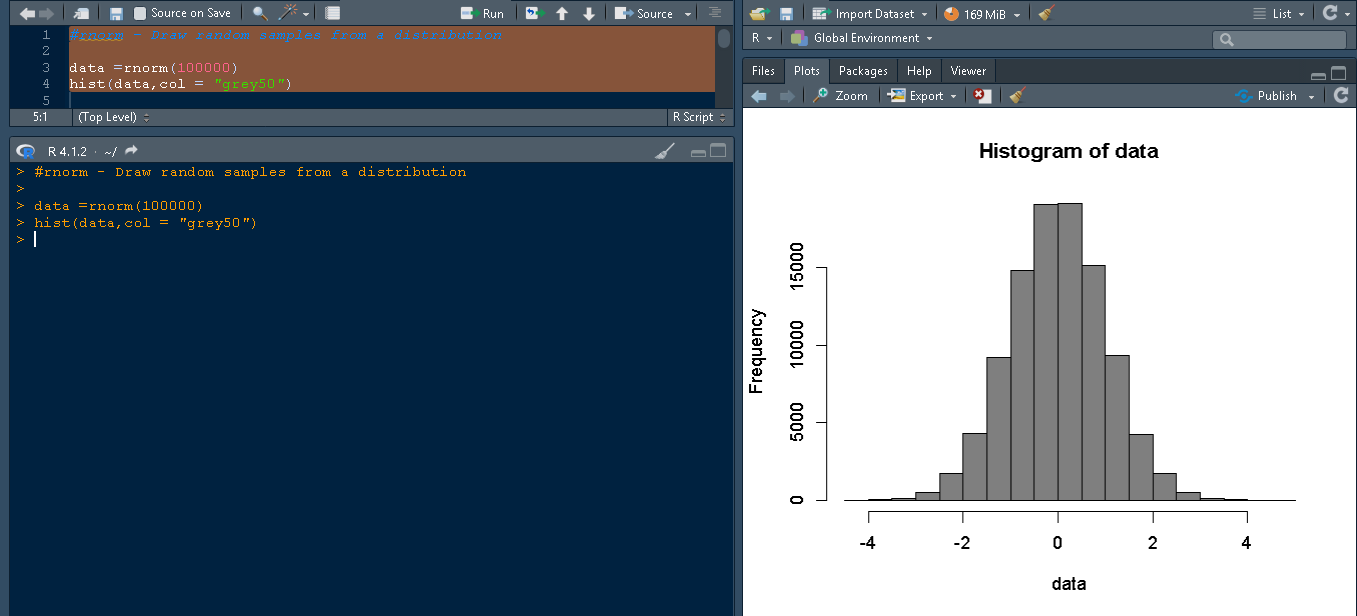
在 R 编程语言中,rnorm 允许从分布中抽取随机值,特别是正态分布。让我们尝试从正态分布中抽取 100000 个值,并查看直方图,其中值按如图所示绘制。
#rnorm - Draw random samples from a distribution

data =rnorm(100000)
hist(data,col = "grey50")
上面的代码显示了 rnorm() 函数,rnorm 的语法是:
rnorm(n, mean = 0, sd = 1)
代码片段显示了 rnorm() 创建的直方图,
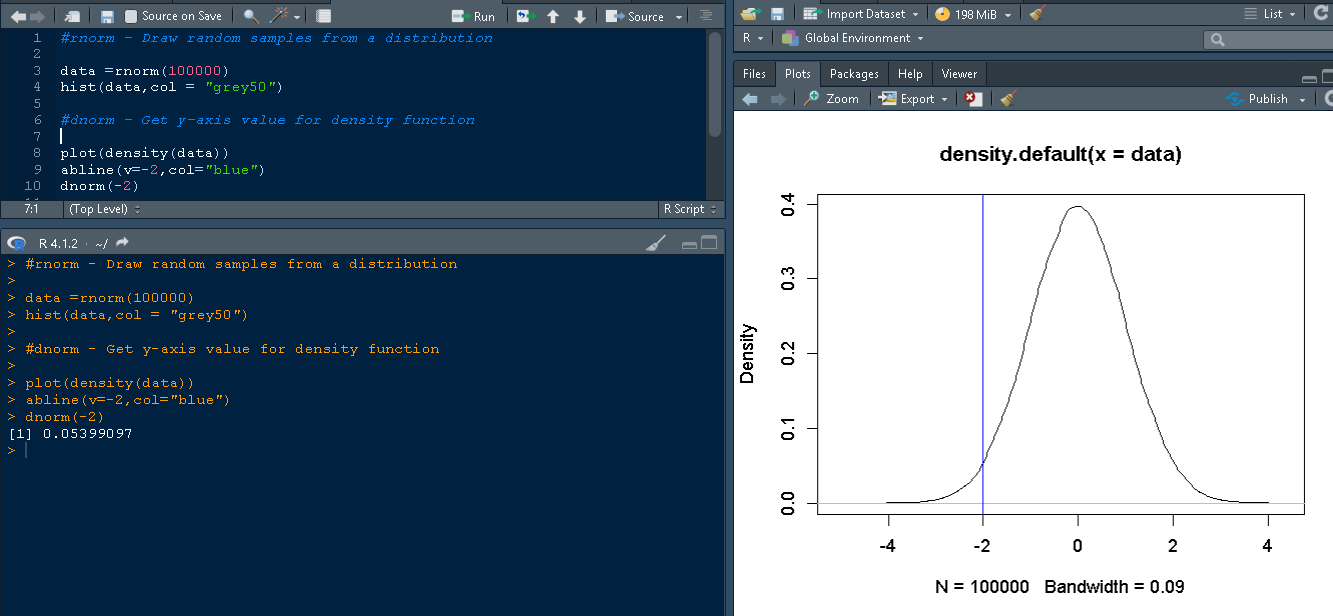
该函数提供图中 x 轴对应的 y 轴值。
dnorm(x, mean = 0, sd = 1, log = FALSE)
假设您想知道 x 轴上值为 -2 时 y 轴的值。通过使用 dnorm(-2),我们大致得到以下输出:
> dnorm(-2)
[1] 0.05399097
检查曲线上特定值或更低的值的面积。让我们通过对上面为 rnorm 创建的数据使用 plot() 函数来绘制数据密度,以便更好地理解概念。
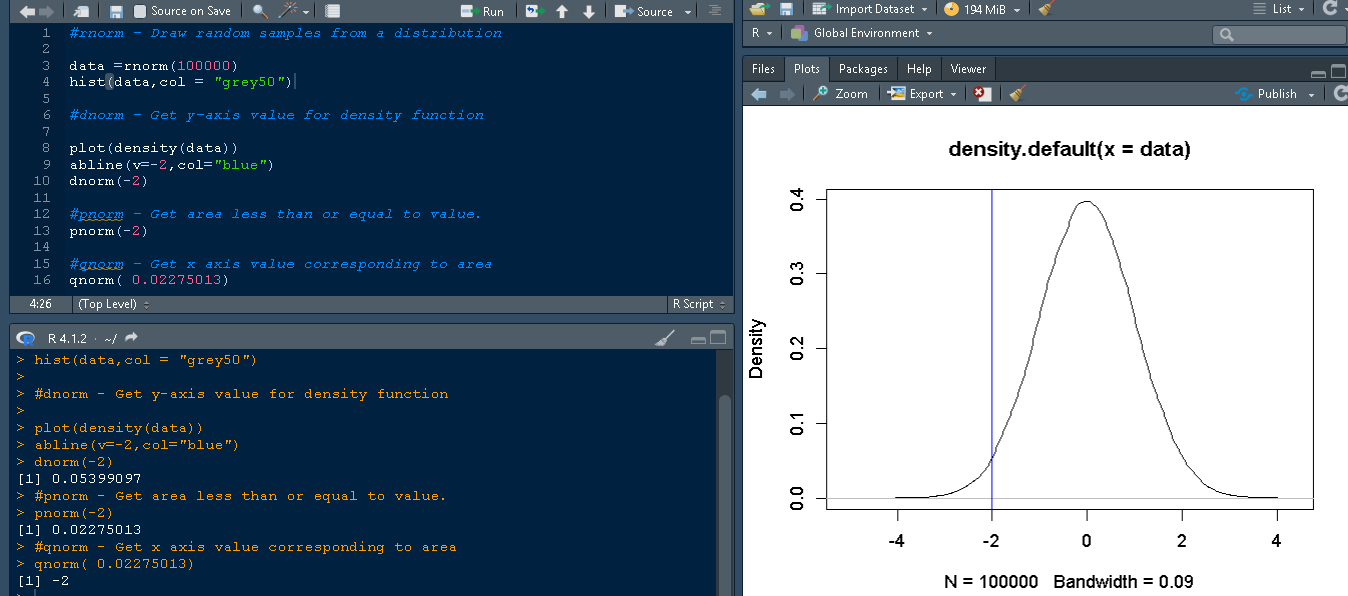
RStudio 中的代码片段显示了对应于数据图,其中在 -2 处有一条蓝线。为了知道这条曲线(-2 以下)下的面积,请使用 pnorm 函数。要查找 -2 以下面积的 pnorm,请使用此语法:
pnorm(-2)
它产生的输出表明曲线下的面积或蓝线处的面积为 0.02275013。
> pnorm(-2)
[1] 0.02275013
此函数执行的操作与 pnorm() 完全相反或相反。假设您想检查值为 0.02275013 的面积,但您不知道 x 轴上与之对应的确切值。这可以通过 qnorm 函数完成。
qnorm(0.02275013)
其输出返回 x 轴上对应的值 -2。
[1] -2
查看 pnorm() 函数,我们讨论了相同的要点。pnorm() 和 qnorm() 函数的功能是相反的。
我们需要在统计分布下讨论更多内容,这些内容将在另一个教程中介绍。现在,只需了解有一些函数可以处理统计概率分布。
除了上述类型的统计函数之外,还有一些其他函数。下表描述了附加的统计函数及其示例。
| 序号 | 内置函数 | 描述 | 示例 |
|---|---|---|---|
| 1 | mean(x, trim=0, na.rm=FALSE) |
计算一组数字的平均值或均值。简单计算对象 x 的均值。 | x=c(2,3,4,5) mean(x, trim=0,na.rm=FALSE) Output [1] 3.5 |
| 2 | sd(x) | 返回对象的标准差。 | x=c(2,3,4,5) print(sd(x)) Output [1] 1.290994 |
| 3 | median(x) | 返回中位数 | x=c(2,3,4,5) print(median(x)) Output [1] 3.5 |
| 4 | range(x) | 返回范围 | x=c(2,3,4,5) print(range(x)) Output [1] 2 5 |
| 5 | sum(x) | 返回总和。 | x=c(2,3,4,5) print(range(x)) Output [1] 14 |
| 6 | diff(x, lag=1) | 返回差值,其中 lag 指示使用哪个滞后。 | x=c(2,3,4,5) print(diff(x,lag=1)) x=c(2,3,4,5) print(diff(x,lag=2)) x=c(5,10,15,20,25,30) print(diff(x,lag=2)) Output [1] 1 1 1 [1] 2 2 [1] 10 10 10 10 |
| 7 | min(x) | 返回对象的最小值。 | x=c(5,10,15,20,25,30) print(min(x)) Output [1] 5 |
| 8 | max(x) | 返回对象的 maximum 值。 | x=c(5,10,15,20,25,30) print(max(x)) Output [1] 30 |
| 9 | scale(x, center=TRUE, scale=TRUE) | 列中心化或标准化矩阵。 | x = matrix(1:15, nrow=3, ncol=5,byrow =TRUE) print(x) Output [,1] [,2] [,3] [,4] [,5] [1,] 1 2 3 4 5 [2,] 6 7 8 9 10 [3,] 11 12 13 14 15 print(scale(x, center=TRUE, scale=TRUE)) Output [,1] [,2] [,3] [,4] [,5] [1,] -1 -1 -1 -1 -1 [2,] 0 0 0 0 0 [3,] 1 1 1 1 attr(,"scaled:center") [1] 6 7 8 9 10 attr(,"scaled:scale") [1] 5 5 5 5 5 |